In part one we saw how to obtain the data to analyze, the heap dumps. Now we are looking into a nice plugin for the Eclipse IDE for analyzing the dumps. Compared to the basic tools described in the previous article Memory Analyzer Tool (MAT) offers better usability, performance and some high level analysis and report tools. After you open a hprof heap dump with MAT it will generate index files for faster access to all the data you are interested in and show an overview with nice charts. From here you have access to other views and features:
- The histogram is somewhat similar to what jHat offers.
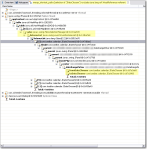
 It allows you to browse, sort and filter the object instances in memory and shows you instance count and the shallow heap (memory used only by this object instance) and retained heap (memory used by this object instance including referenced objects). From the context menu you can choose “Merge Shortest Paths to GC roots” to see the reference chain of an object all the way up to the classloader. Here we can see that the JDateChooser registers itself at the
 MenuSelectionManageras a listener which can cause serious memory leaks as described in another post about Java memory handling. - The dominator tree allows you to quickly identify the biggest objects and what they reference. Again, using the context menu on an item in the list offers many options to dive deeper into the analysis.
- The object inspector gives you detailed information about the selected objects like shallow and retained size, its fields and the class loader by whom it was loaded.
- The leak suspects report tries to give you some high level hints about possible causes of memory problems of your application.
 The component report provides some very interesting statistics about Strings and collection usage which might be worth looking at if you are not hunting down leaks but trying to reduce overall memory usage. You can even get performance hints when many overfull HashMaps are detected or there are many empty collections which could be better lazily created.
I personally am using the histogram and the dominator tree the most because I am a technical guy and like to hunt down the problems in the code. Nevertheless the reports may show use other valuable aspects which you did not think of before. The MAT team are expanding the tools nicely on that side so that the benefit of these reports is ever increasing.
It is very likely that when you analyze large heap dumps you may need to increase the Java heap size for Eclipse by using the -vmargs -Xmx<memory size> parameter. That way you are able to analyze big heaps > 500M relatively fast and comfortable. For some live demo take a look at a webinar by some of SAPs Eclipse MAT committers.

One thought on “Analyzing Java Heap problems Part 2: Using Eclipse MAT”